Calculate Statistics for a Graph Database (SPMF documentation)
This example explains how to calculate statistics for a graph database using the SPMF open-source data mining library.
How to run this example?
If you are using the graphical interface, (1) choose the "Calculate_stats_for_a_graph_database" algorithm, (2) choose the input file contextTKG.txt (3) click "Run algorithm".
- If you want to execute this example from the command line,
then execute this command:
java -jar spmf.jar run Calculate_stats_for_a_graph_database contextTKG.txt no_output_file in a folder containing spmf.jar and the input file contextTKG.txt. - If you are using the source code version of SPMF, launch the file "MainTestGenerateGraphDatabaseStats.java" in the package ca.pfv.SPMF.tests.
What is this tool?
This tool is a tool for generating statistics about a graph database. This tool can be used to learn about the characteristics of a graph database. Graph databases can be used with several graph mining algorithms such as TKG and GSpan.
What is the input?
The input is a set of labeled connected graphs.
To explain the input more clearly, some definitions are first introduced. A labeled graph is a set of vertices and edges, having some labels. Let’s me illustrate this idea with an example. Consider the following graph:
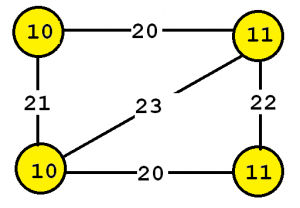
This graph contains four vertices (depicted as yellow circles). These vertices have labels such as “10” and “11”. These labels provide information about the vertices. For example, imagine that this graph is a chemical molecule. The label 10 and 11 could represent the chemical elements of Hydrogen and Oxygen, respectively. Labels do not need to be unique. In other words, the same labels may be used to describe several vertices in the same graph. For example, if the above graph represents a chemical molecule, the labels “10” and “11” could be used for all vertices representing Oxygen and Hydrogen, respectively.
Now, besides vertices, a graph also contains edges. The edges are the lines between the vertices, here represented by thick black lines. Edges also have some labels. In this example, four labels are used, which are 20, 21, 22 and 23. These labels represents different types of relationships between vertices. Edge labels do not need to be unique. A graph is a connected graph if by following the edges, it is possible to go from any vertex to any other vertices.
The algorithm takes a graph database as input. For example, let’s consider the following graph database containing three graphs, which is provided in the file contextTKG.txt of the SPMF distribution.
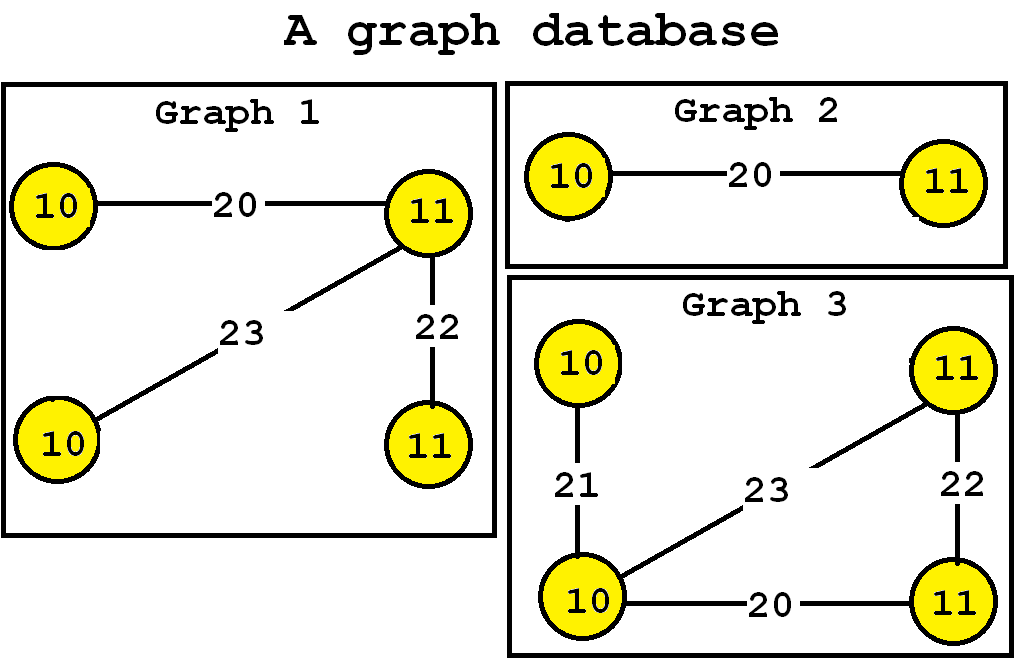
This database contains three graphs, respectively called Graph 1, 2 and 3.
What is the output?
The output is statistics about the graph database. For example, if we use the tool on the previous graph database given as example, we get the following statistics:
============ GRAPH DATABASE STATS ==========
Number of graphs : 3
File /D:/workspace/SPMF_2019_for_release/bin/ca/pfv/spmf/tools/dataset_stats/contextTKG.txt
Number of distinct vertex labels: 2
Number of distinct edge labels: 4
Largest vertex label: 11
Largest edge label: 23
Average number of vertices per graph : 3.3333333333333335 standard deviation: 0.9428090415820634 variance: 0.8888888888888888
Average number of edges per graph : 2.6666666666666665 standard deviation: 1.247219128924647 variance: 1.5555555555555554
Input file format
The input file format is defined as follows. It is a text file which contains one or more graphs. A graph is defined by a few lines of text that follow the following format:
- t # N This is the first line of a graph. It indicates that this is the N-th graph in the file
- v M L This line defines the M-th vertex of the current graph, which has a label L
- e P Q L This line defines an edge, which connects the P-th vertex with the Q-th vertex. This edge has the label L
For the above example, the input file is defined as follows:
t # 0
v 0 10
v 1 11
v 2 10
v 3 11
e 0 1 20
e 1 2 23
e 1 3 22
t # 1
v 4 10
v 5 11
e 4 5 20
t # 2
v 6 10
v 7 10
v 8 11
v 9 11
e 6 7 21
e 7 8 23
e 7 9 20
e 8 9 22