Calculate Statistics for a Time-Interval Sequence Database (SPMF documentation)
This example explains how to calculate statistics for a time-interval sequence database using the SPMF open-source data mining library.
How to run this example?
- If you are using the graphical interface, (1) choose the "Calculate_stats_for_an_interval_sequence_database" algorithm, (2) choose the input file test.csv (3) click "Run algorithm".
- If you want to execute this example from the command line,
then execute this command:
java -jar spmf.jar run Calculate_stats_for_an_interval_sequence_database test.csv no_output_file in a folder containing spmf.jar and the input file test.csv. - If you are using the source code version of SPMF, launch the file "MainTestStatsIntervalSeqDatabase.java" in the package ca.pfv.SPMF.tests.
What is this tool?
This tool is a tool for generating statistics about a time-interval sequence database, as used by algorithms such as FastTIRP and VertTIRP.
What is the input?
The input is a sequence database.
A time-interval sequence database is a set of sequences, where each sequence contains multiple events. Each event is represented by a time interval, that is a start time and an end time. In other words, each event has a duration.
For example, here is a picture of a time interval sequence database containing three sequences, here called S1, S2 and S3:.
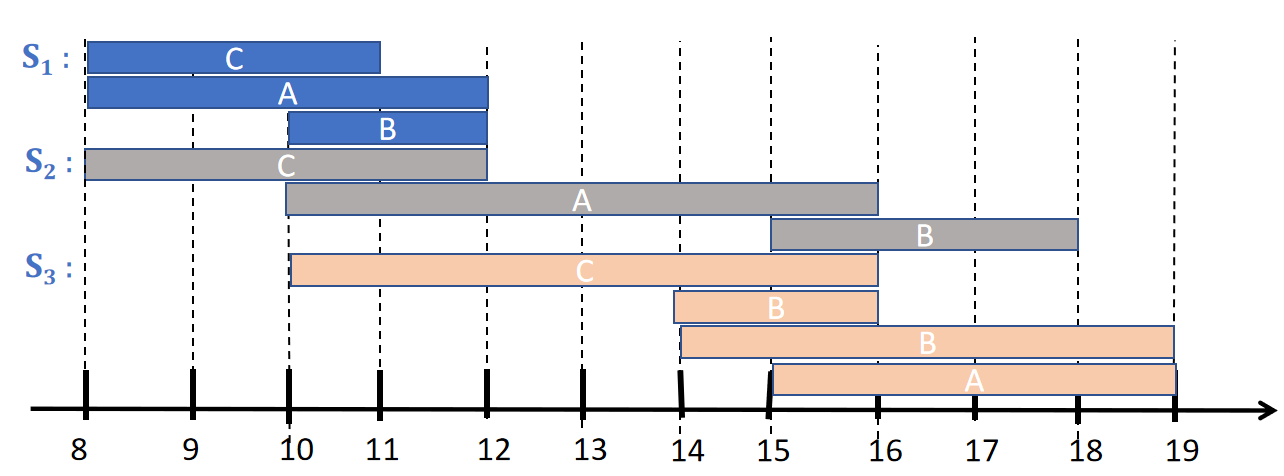
The first sequence (S1) indicates that an event of type C started at time 8 and ended at time 11, that an event of type A started at time 8 and ended at time 12, and an event of type B started at time 10 and ended at time 12.
The second sequence (S2) indicates that an event of type C started at time 8 and ended at time 12, that an event of type A started at time 10 and ended at time 16, and an event of type B started at time 15 and ended at time 18.
The third sequence (S3) indicates that an event of type C started at time 10 and ended at time 16, that an event of type A started at time 15 and ended at time 19, an event of type B started at time 14 and ended at time 16, and another event of type B started at time 14 and ended at time 19.
Time interval sequence databases can be used inmany applications. For example, it can be used to encode data about daily activities (A = having a meeting, B = making a phone call, C = eating).
The above example is provided in the file test.csv of the SPMF distribution. The content is as follows:
8,12,1;10,12,2;8,11,3;
8,12,3;10,16,1;15,18,2;
10,16,3;14,19,2;15,19,1;14,16,2;
In this format, each event type is an integer (A = 1, B = 2, C =3).
Then, each line is a sequence. This file has three lines and thus three sequences.
In a sequence (line), each event is represented using the format X,Y,Z; where X is the start time, Y is the end time, and Z is the event type.
For instance, the first line indicates that an event of type 1 (which was called A in the above example) has started at time 8 and ended at time 12, that an event of type 2 (which was called B in the above example) started at time 10 and ended at time 12, and that an event of type 3 (called C in the above example) started at time 8 and ended at time 11. The other lines follow the same format.
What is the output?
The output is statistics about the database. For example, if we use the tool on the previous database given as example, we get the following statistics:
============= Interval sequence database stats- STATS =============
Dataset: C:\Users\Phil\Desktop\test_files\test.csv
Number of sequences: 3
Number of distinct event types: 3
Number of time intervals: 9
Average duration of time intervals: 3.9 standard deviation: 1.374772708486752 variance: 1.8900000000000001
Average number of time intervals per sequence: 3.0
=============================================================